

Creating marketing material without data is like forecasting the weather with a broken barometer. You might guess right sometimes. But mostly, you’re just guessing.
The days of guessing are over. Modern businesses can’t afford to fly blind anymore. Now, moving from creative guesses to data-driven editing is not just wise—it’s essential.
As one wise person said, “Data is never just about the data—it’s how we use and make sense of the data.” The real magic is in understanding the story the data tells and the strategies it guides.
It’s like switching from a dartboard to a laser sight. The old way was based on guesses and hopes. The new way uses solid evidence. It’s the difference between shouting into the void and having a real conversation with your audience.
This is where creativity meets science. Let’s explore how to make that transition.
The Value of Analytics for Marketers
Data isn’t just numbers; it’s the secrets of your audience. It’s time to move beyond the dark art of marketing. Today, we’re strategic analysts, using dashboards as our guide.
A big change is happening. Now, 64% of marketing leaders say data-driven strategies are key to success. We’ve moved from guessing to knowing, thanks to hard evidence.
Privacy laws like GDPR and CCPA have changed the game. The old ways of tracking users are no longer allowed. But this change has made us better.
We’re now focusing on first-party data, which is more accurate and respectful. It helps us connect with our audience in a real way.
Analytics let us listen to our audience. They give us the conversation transcript. Our job is to understand it.
This understanding builds trust. When we use data to solve problems, we’re not just selling. We’re helping. This is the foundation of a relationship based on consent.
The practice of data-driven editing is based on this. It uses audience signals to improve our messages. It turns content into a two-way conversation.
Here’s how it works:
- Old Way: “This headline feels clever. Publish it!”
- New Way: “Our data shows question-based headlines in this niche have a 40% higher engagement rate. Let’s edit.”
Analytics help us speak directly to our audience. They give us meaningful signals in a noisy world. Being data-informed is like having a map in a foreign city.
Using analytics doesn’t mean sacrificing creativity. It means giving that creativity direction and purpose. It’s the difference between random acts of art and a masterpiece.
Adopting a mindset of data-driven editing is key. It makes our content resonate and last. It’s our strategic lifeline and our only real advantage.
Gathering Data From Tools
Think of your content’s performance data as a crime scene. Your job is to gather every piece of evidence. This isn’t about choosing a lunch spot, but about updating SEO content that needs to perform. You need a systematic inventory, starting with understanding your data’s pedigree.
All data is not created equal. I categorize it into three tiers, like a prospector sorts nuggets.
First-Party Data is your gold. This is the information users give you directly: email sign-ups, form submissions, on-site behavior, support queries. It’s volunteered, specific, and rich with intent. You own it.
Second-Party Data is the silver. This is another company’s first-party data, shared with you through a strategic partnership. It’s valuable, but you’re using someone else’s map to look for your treasure.
Third-Party Data is, increasingly, fool’s gold. It’s the aggregated, often outdated information bought from brokers. In a privacy-conscious world, its luster is fading fast.
The real game is in mining your first-party reserves. This isn’t about sneaky tracking; it’s about a value exchange. Offer a stellar newsletter, an insightful whitepaper, or exclusive access. In return, you get permission to listen. The insights are profound. What pain points are hidden in your CRM’s support tickets? Where do users silently exit your website analytics funnel? This is the raw material for intelligent content improvement.
Your toolkit for this excavation is critical. Google Analytics is your base camp, showing the broad landscape of traffic and engagement. But don’t stop at pageviews. Dive into Behavior Flow reports to see where people get lost or bored.
Your CRM system is a confessional. Sales and support logs are pure, unfiltered voice-of-customer data. What questions do they keep asking? What frustrations do they repeatedly voice?
Social media insights and social listening tools are the town square. Here, you hear the unfiltered chatter—the mentions, the slang, the genuine reactions your branded content might never elicit. Pair these with essential content analytics tools for a complete diagnostic picture.
This isn’t just data collection; it’s clue assembly. Each metric, each comment, each abandoned cart is a piece of the puzzle. When you gather this intel systematically, you stop guessing what your audience wants. You know. And that knowledge is the only solid foundation for any successful content strategy.
Identifying Content Gaps and Weaknesses
Data-informed ideation is about listening to what your audience wants and talks about. It’s about connecting their needs to your expertise. This isn’t just guessing. It’s like solving a mystery with your analytics as the clue.
To spot these issues, you need three tools. Think of them as your forensic kit for a content refresh strategy.
| Data Source | What It Reveals | Key Tool Example | The “Sweet Spot” Insight |
|---|---|---|---|
| Search Data | Queries you rank for on page 2, related questions you haven’t answered, and competitor topics you’re missing. | SEMrush, Ahrefs | The intersection of high search volume and your unique brand perspective. |
| Customer Feedback | Recurring support tickets, feature requests in your CRM, and post-purchase confusion. | Zendesk, Salesforce | The gap between what you promised and what the user actually needed to know. |
| Social Listening | Conversations where your brand is absent, unanswered questions, and emerging niche jargon. | Brandwatch, Mention | The cultural moment or community pain point you can authentically speak to. |
The magic is in the right-hand column of that table. That “sweet spot” is your goldmine. It’s where audience demand meets your authority. A keyword with high volume but zero relevance to your brand is just noise. Your deep expertise on a topic no one searches for is a soliloquy. The goal is to operate in the profitable overlap.
For instance, those page-two rankings from your SEMrush report? They’re not failures. They’re your audience waving a flag, saying, “You’re close! Just tweak this.” Those whack-a-mole support tickets? They’re screaming for a definitive guide you haven’t written yet. This process of identification transforms weaknesses from moral failings into a strategic asset. It’s the first audit in any sustainable content refresh strategy.
You’re not admitting defeat. You’re locating opportunity. And that’s how you turn data points into a game plan.
Prioritizing Updates
Think of your content audit like a triage unit. Not every patient needs the same care. You’re looking at a list of underperformers, like a 5-year-old blog post and a new product page.
Do you try to save the old blog post or focus on the new one? This is where strategy matters. It’s about making smart choices based on data.
Without a plan, updating content is just busywork. You need a clear strategy based on data. This ensures you’re doing the right work. The goal is to have a content refresh strategy that guides you.
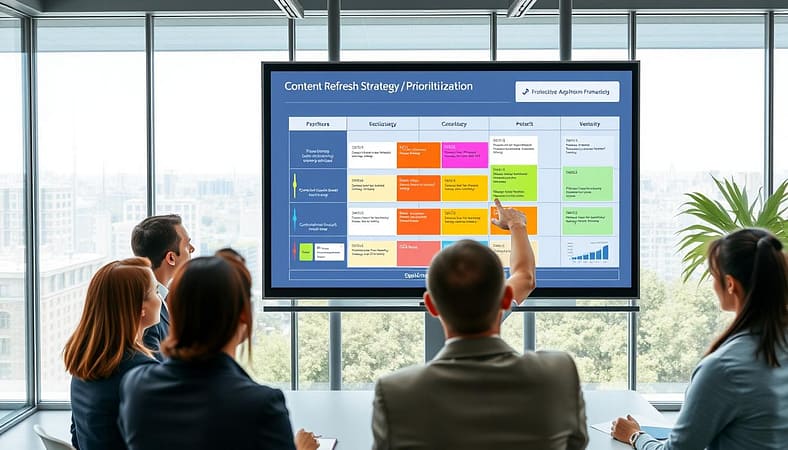
So, how do you decide what to do first? You look at three things: how much you can gain, how it aligns with your goals, and how much effort it takes.
- Potential Traffic Lift: How much can you improve this page’s search ranking? A page with good rankings but old info is a good choice.
- Alignment with Business Goals: Does this content help meet your goals? Fixing a page that helps sales is more important than a blog post.
- Effort Required (The “Sweat Equity”): Be honest about how much work it needs. A small edit that makes a big difference is a quick win.
This approach needs agile data management. Your rules must change as new data comes in and goals shift. Know what you want to achieve, like a 20% increase in traffic.
Using this method, you get a clear plan. You’ll know what to do first, from quick fixes to big projects. It turns chaos into a clear mission. This is what a smart content refresh strategy looks like.
It’s about using your time wisely. Your time and your team’s is limited. Spending it on the wrong content is a mistake. By focusing on the right things, you make every update count. You move from reacting to planning.
Implementing Changes (SEO, UX, CTAs)
Making changes based on data is like conducting an orchestra. SEO, user experience, and calls to action must work together. This is where your insights become real.
Updating SEO content is a big job. It’s not just about adding keywords. It’s about making your website better in every way.
Artificial intelligence is your partner in this work. It helps you plan, so you can add the personal touch. Think of AI as the architect, and you as the artist.
This team effort makes your content better and faster. It’s like using a power sander instead of sanding by hand. You get the job done quicker.
Your SEO work starts with smart keyword use. You’re not just adding words. You’re making them part of the story. Use your data to find the best keywords and place them wisely.
Next, improve your user experience. Look at your scroll-depth and bounce rate reports. If people are leaving early, your content might be too long. Break it up with subheadings and bullet points.
Is your page slow? Speed is important. Make it faster by compressing images and using browser caching. A slow page can hurt your sales.
Now, focus on your call to action. It should be helpful, not pushy. Use your analytics to find the right next step for your readers.
For example, if you have a guide, your CTA might be a case study. If it’s a product review, it could be a comparison chart. Your CTA should be clear and helpful.
Remember, all parts of your strategy must work together. Strong SEO attracts visitors. Flawless UX keeps them engaged. A clear CTA guides them to action. Ignore any one, and your effort will fail.
This is the creative side of using data. You’re not just updating SEO content. You’re making your website better, step by step.
Measuring Results After Updating
So, you’ve launched your updated masterpiece into the digital world. Now, it’s time to see if it worked. The excitement is great, but what really matters is the data.
First, let’s ignore the vanity metrics. Likes, shares, and pageviews are fun but don’t tell the whole story. They don’t show if your changes made a real difference.

Focus on what matters to your business. Look at these key performance indicators (KPIs):
- Conversion Rate: Did more visitors take your desired action? This shows if your edits worked.
- Lead Quality: Are the emails and sign-ups better? Good content should attract the right people.
- Content-Influenced Revenue: Can you link actual dollars to this piece? This is the ultimate goal of data-driven editing.
- Audience Retention: Are people staying longer on your site? This means you’ve caught their interest.
But, giving all the credit to the last click is unfair. That’s where attribution models come in.
Attribution helps figure out who deserves credit in a customer’s journey. The First-Touch model gives credit to the first interaction. The Last-Touch model credits the last step before conversion.
Both models are simple. For content that builds over time, you need Multi-Touch models. A Linear model splits credit evenly. A Time-Decay model gives more credit to recent interactions.
Why does this matter for your update? If your article is part of a larger story, Last-Touch attribution might not show its value. Multi-Touch models reveal its role in educating and persuading the audience. This is the heart of data-driven editing.
Measuring results is not just about checking the scoreboard after the game. It’s about learning for the next game. Did your changes make a difference? Now you know. And that knowledge helps you keep improving.
Ongoing Optimization Habits
If your content refresh strategy feels like a frantic, once-a-year spring cleaning, you’re doing it wrong. We’ve all seen it: the quarterly panic, the dashboards pulled in a last-minute meeting, the scramble to “fix” things before the board report. It’s exhausting. More importantly, it’s ineffective.
True optimization isn’t a campaign. It’s the rhythm of your content’s heartbeat. The goal is to build a perpetually learning machine, not just a one-time fix. This shift requires cultivating habits, not just executing projects.
The first habit is democratizing data. Locking analytics in a “data team” silo is like having an orchestra where only the conductor can read music. Everyone—from the writer drafting a headline to the social manager scheduling a post—needs access. Give them user-friendly tools. Think simple dashboards, not PhD-level spreadsheets.
When data is a shared language, a curious culture emerges. The writer starts asking why one intro outperforms another. The designer wonders if a new CTA button color moves the needle. This is how you build a team that actually thinks with an analytical mindset.
Next, institutionalize the audit. Schedule a recurring “content health check” every quarter, or even monthly for high-traffic pages. This isn’t a forensic deep dive every time. It’s a routine pulse check. Look for trends, not just snapshots. Is organic traffic for a key pillar page on a slow decline? Are bounce rates creeping up across a topic cluster?
This leads to the most critical habit: closing the feedback loop. Data should flow directly back to the creators. Establish a simple system. A monthly “Insights & Iteration” meeting works wonders. Present three data points, discuss two hypotheses, and commit to one test. This turns your content refresh strategy from a reactive scramble into a proactive, rhythmic part of your operations.
Build these habits into your workflow:
- Shared Dashboards: Make key metrics visible to all content roles.
- Scheduled Reviews: Calendar your audits like any other critical meeting.
- Blameless Analysis: Focus on “what” and “why,” not “who.”
- Test & Learn Logs: Document changes and their outcomes, creating an institutional memory.
The biggest mistake is treating optimization as an event. It’s a culture. It’s the quiet confidence of knowing your machine is always learning, always tuning, always evolving. Stop the annual scramble. Start the daily habit.
Success Story
Let’s talk proof, not theory. Data-driven strategy often sounds like corporate jargon until you see the numbers.
Boie, a personal care brand, partnered with InboxArmy. They focused on updating SEO content and executing precise email campaigns. The result? A 650% spike in holiday sales for 2019.
Year-over-year revenue jumped 120%. Their email list grew 500% in under three years. How?
They used simple, data-informed levers. Attention-grabbing popups and website forms captured leads. A 10% discount offer converted them. Holiday-targeted email sequences did the rest.
This wasn’t magic. It was the systematic process of updating SEO content based on what the analytics whispered. They stopped guessing what the audience wanted and started knowing.
The playbook is clear. Analyze, identify, update, and measure. The CFO’s smile at a 120% increase says more than any best-practice guide ever could.